|
(For installation instructions under Windows, please see this link.) StartWhen you run GcEad/2012, you will be presented with an empty project. At this point, you can either record new data or load an existing project file. Alternatively, if you just want to play around with the program without first record data, you can select "Load Sample Project" from the "File" menu. Lets take a quick look at the program: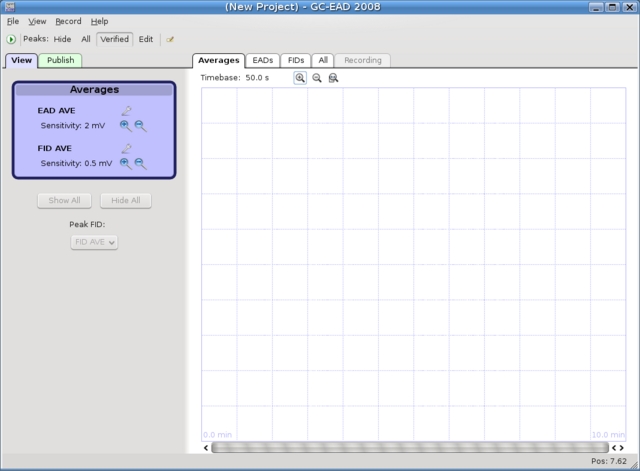 Toolbar The first button lets you start recording. The next several options let you view and edit peaks in the data (more about this later). The last button lets you add a comment for the project. View/Publish modes Below the toolbar on the left, there are two tabs: View and Publish. In View mode, you can adjust the recorded data in the graph on the right (in the screenshot above, no data has been recorded yet, so the graph is empty). Once you have recorded and adjusted the data to your liking, you can use the Publish mode to either print a report or save an image of the graph. Graph perspectives Above the graph are five tabs that contain different perspectives on the data: Averages, EADs, FIDs, All, Recording. RecordingTo start recording, you need to open the recording window. This can be done by:
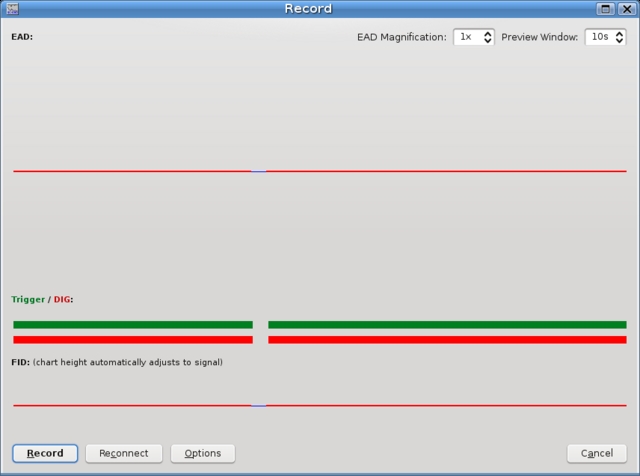 Once you have verified that all inputs are present, you can click the [Record] button to start recording. If this is your first time using GcEad/2012, you'll want to open the options dialog by clicking on the [Options] button: 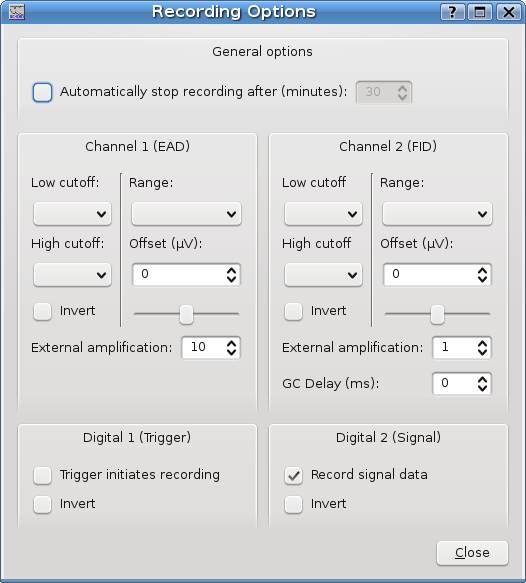 ViewOnce you have recorded data, you might want to adjust it. Here is a screenshot of the sample project (with it's somewhat artificial data).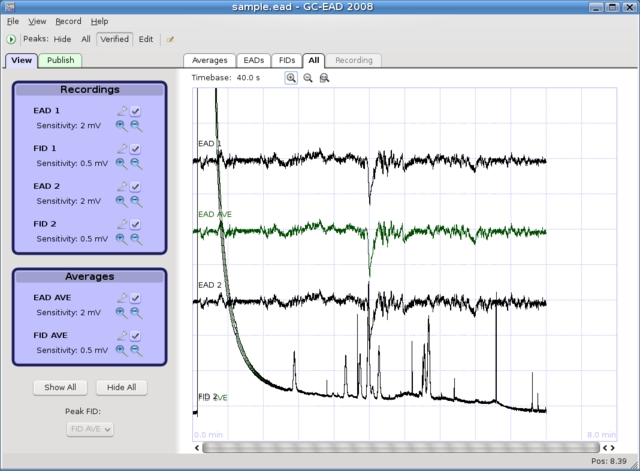 Signal List Signal Properties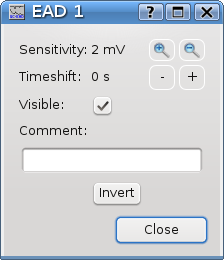 Edit PeaksBy clicking on "Edit" in the toolbar, you can start editing peaks. Note that you can only edit peaks in View mode, and you cannot edit peaks on the EADs graph. You will need to select which FID signal to edit peaks on by selecting a signal from the drop-down box beneath the signal list on the left.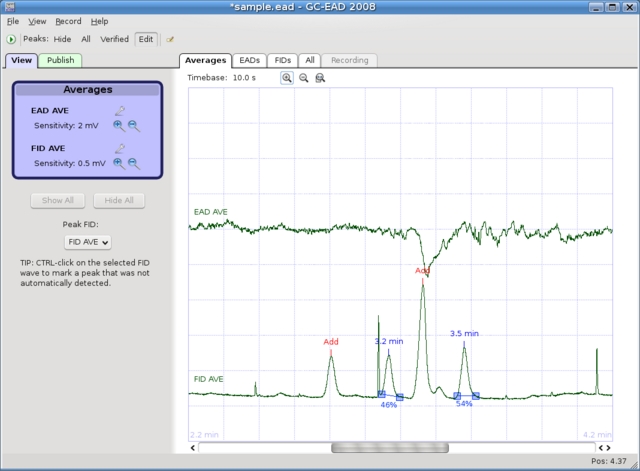 PublishIn Publish mode, you can select which graph elements to display and specify the dimensions of the graph.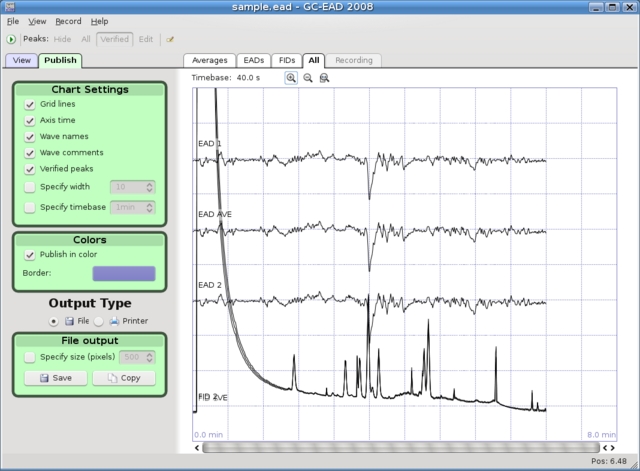
|


GcEad/2012 - Documentation

